Cracking the Code of Digital Sales: A Data-Driven Exploration
The Challenge: Navigating the Blind Spots of Online Sales
For businesses selling digital products online, success isn't just about creating great products—it’s about understanding what sells, where customers come from, and how much profit actually reaches the creator’s pocket.
This was precisely the challenge faced by a company selling 15 products on a designated digital marketplace. While sales were steady, the company lacked in-depth analytics to track key performance indicators such as net profit, number of items sold, customer demographics, and return rates.
Why was this a problem?
- 📉 The marketplace deducted fees and taxes, but didn’t provide clear reports on true earnings. Moreover some taxes portion was collected based on the customer's country of origin, which resulted in the higher fee rate.
- 📊 Sales reports existed, showing order details, but product profitability and customer trends remained unclear.
- 🤷 Without data-driven insights, the company risked making misguided decisions on pricing and marketing strategies.
To help the company gain clarity and optimize its strategy, I conducted a comprehensive data analysis using SQL, SQLite, Python, and Tableau.
The Mission: Extracting Insights from Data
My goal was to answer key business questions that would directly impact the company’s bottom line:
- ✅ Sales Performance: How many orders were processed in 2023? What were the total revenue, profit, profit margin, and return rate?
- ✅ Customer Demographics: Which countries contributed the most to sales?
- ✅ Best-Selling Products: Which products were the top sellers?
- ✅ Profitability Analysis: Which products generated the highest profit after deductions?
- ✅ Return Rate Insights: Which products had the highest return rates, and why?
The Process: Turning Raw Data into Actionable Insights
Before starting analyzing sales performance:
- ✅ I used Python to extract and clean transaction data from the company’s sales records, ensuring that all fees, refunds, and taxes were properly accounted for.
- ✅ I aslo transformed data into appropriate formats to ensure accurate calculations.
- ✅ I removed unnecessary columns and rows, as well as created additional column to show the product names for simplifying data management.
      import pandas as pd

      # Loading the initial CSV file
      df = pd.read_csv('digital_market_2023.csv')

      # Removing unnecessary rows and columns
      df = df[df['Type'] != 'Payout']
      df.drop(['Document', 'Sales Tax Type', 'Site', 'Other Party Region', 'Other Party Zipcode'], axis=1, inplace=True)

      #Transforming data types, filling NaN values, and changing number formats.
      df['AU RWT'] = df['AU RWT'].fillna(0).round(0).astype(int)
      df['US RWT'] = df['US RWT'].fillna(0).round(0).astype(int)
      df['US BWT'] = df['US BWT'].fillna(0).round(0).astype(int)
      df['Sales Tax Amount'] = df['Sales Tax Amount'].fillna(0).round(0).astype(int)
      df['Item ID'] = pd.to_numeric(df['Item ID'], errors="coerce").fillna(0).astype(int).astype(str)
      df['Order ID'] = pd.to_numeric(df['Order ID'], errors="coerce").fillna(0).astype(int).astype(str)
      df['Date'] = pd.to_datetime(df['Date'], utc=True)
      df['Date'] = pd.to_datetime(df['Date']).dt.date

      #Function to add item names according to their IDs.
      def get_item_name(item_id):
          match item_id:
              case "19245326":
                  return "SeoSight WP"
              case "22788499":
                  return "Olympus WP"
              case "19755363":
                  return "Olympus HTML"
              case "17353995":
                  return "SeoSight HTML"
              case "22069917":
                  return "WooX HTML"
              case "20418396":
                  return "Utouch HTML"
              case "16078535":
                  return "Polo WP"
              case "24765590":
                  return "HostSite HTML"
              case "22832072":
                  return "Woox Crypto HTML"
              case "20654547":
                  return "Utouch WP"
              case "23231681":
                  return "Puzzler HTML"
              case "19716647":
                  return "Purchase"
              case "13850909":
                  return "Omni WP"
              case "25715500":
                  return "Purchase"
              case "16964965":
                  return "Modesto WP"
              case "26148134":
                  return "TopTen HTML"
              case "26142710":
                  return "Purchase"
              case "21935448":
                  return "Purchase"
              case "18533327":
                  return "Osvald HTML"
              case _:
                  return "Not an Item"

      #Applying the function to create a column with Item Names.
      df['Item Name'] = df['Item ID'].apply(get_item_name)

      #Converting the final dataframe into a CSV file for further analysis.
      df.to_csv('dm_sales_statement_2023.csv')
Lastly, I transformed the final dataframe into CSV file and got to analyzing it with SQL queries. For SQL analysis I used SQLite server. And here’s what I ended up with!
1. Sales & Profitability Analysis
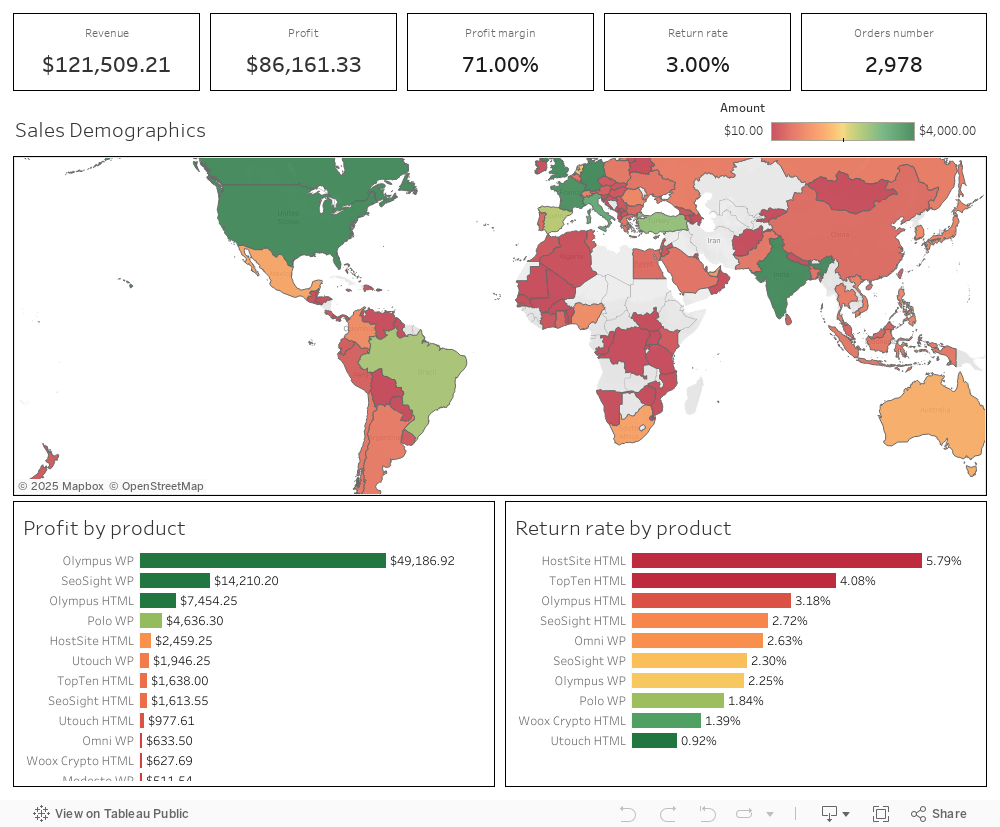
- 💰 2978 orders were processed in 2023, generating $121509.21 in total revenue.
- 📈 After deductions, the company retained $86161.33 in net profit, with a profit margin of 70.91%.
- 🔄 The overall return rate was 2.53%, affecting profitability.
📌 Key Business Takeaway: While revenue looked strong, some products were generating high sales but lower profits due to fees and refunds.
SQL query:
    SELECT COUNT (DISTINCT order_id) AS number_of_orders,
    round (sum(Price),2) AS revenue,
    round (sum(amount) ,2) AS profit,
    round (sum(amount) /sum(Price) * 100.0,2) || '%' AS profit_margin,
    round (100.0 * COUNT(DISTINCT IIF(Type = 'Sale Refund' OR
    Type = 'Sale Reversal', order_id, NULL)) / NULLIF (COUNT(DISTINCT IIF (Type =
    'Sale', order_id, NULL)), 0), 2) || '%' AS return_rate FROM sales_statement_2023
2. Customer Demographics: Where Are Buyers Coming From?
🌎 The top customer regions that drove the most profit were:
- United States - 28.28% ($24369.63)
- India - 10.0% ($8620.26)
- United Kingdom - 7.25% ($6249.78)
- Canada - 4.78% ($4118.39)
- Germany - 4.69% ($4039.78)
- France - 4.46% ($3841.91)
📌 Key Business Takeaway: The company could tailor marketing campaigns toward these regions distributing relevant shares of markering budgets to maximize sales.
SQL query:
    WITH profit_by_country AS (
      SELECT Other_Party_Country AS Country,
      round (sum (Amount),2) AS profit,
      COUNT(iif(
        Type NOT IN ('Author Fee Refund', 'Sale Refund',
                      'Sale Reversal', 'Author Fee Reversal' ),
        Order_ID, NULL)
            )/4 AS number_of_orders
          FROM sales_statement_2023
          WHERE Item_ID IS NOT null
          GROUP BY Other_Party_Country
          ORDER BY profit DESC)

          SELECT country, profit,
          round(profit/(SELECT sum(Amount) FROM sales_statement_2023) * 100, 2) || '%'
          AS profit_rate
          FROM profit_by_country
3. Best-Selling Products vs. Most Profitable Products
While some products sold in high volumes, they didn’t necessarily yield the highest profit margins.
🏆 Top-selling products:
- Olympus WP - 1200 orders
- Olympus HTML - 411 orders
- Seosight WP - 391 orders
💰 Most profitable products:
- Olympus WP - $49186.92 (57.09%)
- Seosight WordPress - $14210.2 (16.49%)
- Olympus HTML - $7454.25 (8.65%)
SQL Query:
    SELECT Item_Name, round(sum(Amount),2) AS profit,
    round(sum(Amount) /
      (select round(sum(Amount),2) as total_profit from sales_statement_2023) * 100.0,2) || '%'
      as profit_rate,
      COUNT(Distinct Order_ID)
      as number_of_orders FROM sales_statement_2023
    GROUP BY Item_Name
    ORDER BY profit DESC
📌 Key Business Takeaway: Focusing on high-profit products rather than high-sales products could increase net revenue.
4. Return Rate Analysis: Identifying Product Issues
While most products had low return rates, some HTML-based products had significantly higher refund rates:
🚩 Products with the highest return rates:
- HostSite HTML - 5.79%
- TopTen HTML - 4.08%
- Olympus HTML - 3.18%
- SeoSight HTML - 2.72%
- Omni WP - 2.63%
- SeoSight WP - 2.3%
- Olympus WP - 2.25%
- Polo WP - 1.84%
- Woox Crypto HTML - 1.39%
- Utouch HTML - 0.92%
SQL Query:
    SELECT Item_Name,
    round (100.0 * (COUNT(DISTINCT IIF(Type = 'Sale Refund' OR Type = 'Sale Reversal',
    order_id, NULL))) /
    NULLIF(COUNT(DISTINCT IIF(Type = 'Sale', order_id, NULL)), 0), 2) || '%'
    AS return_rate
    FROM sales_statement_2023
    WHERE Item_ID IS NOT NULL
    GROUP BY Item_Name
    ORDER BY CAST (return_rate AS REAL) DESC
📌 Key Business Takeaway: Although the highest return rate is not more than 5%, HTML products are clearly the most rejected products. According to the company, HTML products are not fully functional, which may be the main reason for rejections. This fact may be a key indicator that the buyers are mostly the end users rather than developers who purchase HTML products for further development.
Tableau visualization
After performing SQL analysis, I created a Tableau visualization based on the analysis results to showcase numbers as interactive and comprehensive dashboard. This visualization provided stakeholders with a clear, data-driven understanding of sales trends, customer distribution, and product performance empowering them to refine their sales strategies for optimal growth.
Final Insights
By performing the above analysis, and building a Tableau dashboard, I uncovered valuable insights that allowed the company to:
- ✅ Target high-profit products rather than just best-sellers by shifting focus on customer support and version upgrades for these products.
- ✅ Optimize Marketing Campaigns targeting top customer countries and promoting popular products within them to drive more revenue.
- ✅ Address high return-rate products to minimize refunds and prevent further revenue drop. This may include improving funtionality of those products, better documentation for no-tech buyers, products exchange campaigns etc.
🔍 This analysis provided a roadmap for increasing profit by focusing the company's attention on high-profit products, optimizing customer support services, creating efficient marketing strategies, and making overall smarter business decisions.