Courierly Performance Analysis
About the Company
Courierly is a dynamic platform that connects vendors with drivers to facilitate seamless package deliveries. Vendors, ranging from large corporations to small businesses and individuals, place order requests, which drivers employed through the Courierly app can accept or reject. As Courierly continues to grow, analyzing key performance metrics is crucial to optimizing operations and enhancing efficiency.
Objective
This report leverages SQL analysis and Tableau visualization to provide data-driven insights into driver performance, payouts, vendor contributions, and order trends. The goal is to identify patterns that can help Courierly refine its strategies for greater efficiency and profitability.
Applied skills: Excel SQL SQLite Tableau
Stakeholder questions:
- Which 3 drivers have completed the most orders over the last 6 months of 2024?
- How do payouts compare for drivers during promotion periods versus non-promotion periods?
- How many drivers joined in the 2024, and how many of them are still active? A driver is active if they have completed any orders within the last 4 months of 2024.
- Do drivers with Courierly stickers in their cars (Sticker = Y) complete more orders than those without?
- Which type of vendors (Corporate vs. Personal) generates the most revenue for Courierly?
- What is the average total distance per order, and how does it differ between Corporate and Personal vendors?
- What percentage of orders are canceled or rejected, and are there any patterns based on vendor type or order distance?
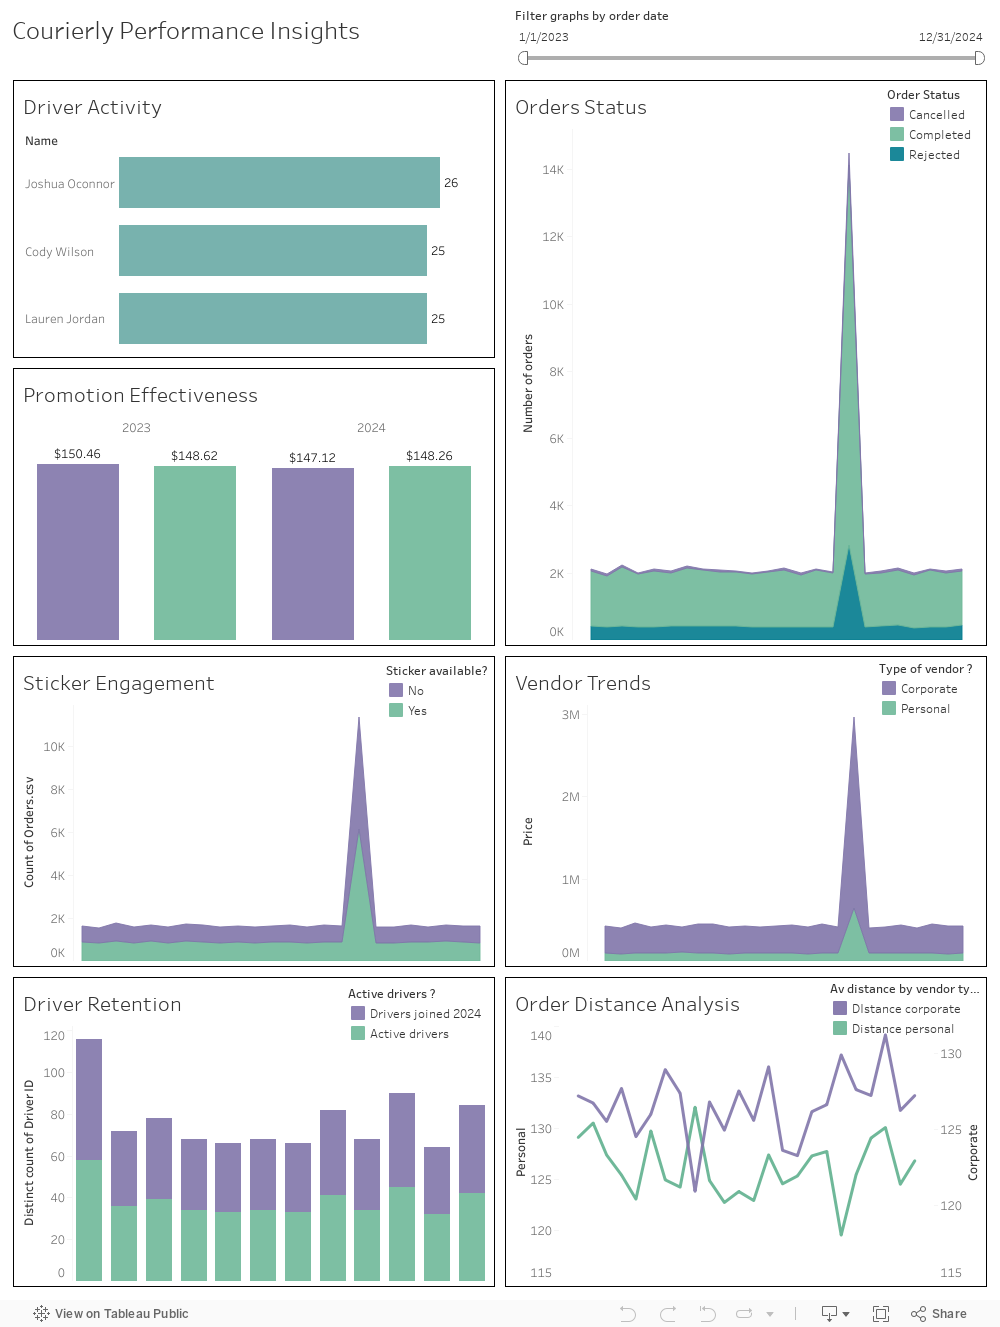
1. Top Performing Drivers
Over the last six months of 2024, three drivers have emerged as the highest performers in terms of completed orders:
- Joshua Oconnor - 26 orders,
- Cody Wilson - 25 orders,
- Lauren Jordan - 25 orders,
These drivers have demonstrated remarkable consistency and efficiency in completing deliveries, making them valuable assets to Courierly’s operations.
SQL query:
      SELECT d.driverid, d.name, COUNT(o.OrderID) AS [Orders Number]
      FROM Drivers d
      LEFT JOIN Order_Status os ON os.DriverID = d.DriverID
      LEFT JOIN Orders o ON o.OrderID = os.OrderID
      WHERE os.OrderStatus = 'Completed'
      AND o.Order_Date BETWEEN datetime('2024-12-31', 'start of month', '+30 days', '-6 month')
      AND date('2024-12-31')
      GROUP BY d.driverid
      ORDER BY COUNT(o.OrderID) DESC
2. Payouts During Promotion vs. Regular Periods
Analyzing driver earnings revealed interesting findings:
- The highest payout during the promotion period was 172.69% more than during non-promo times.
- Conversely, the lowest payout saw an 82.71% decrease compared to regular earnings.
- On average, drivers earned 10.24% more during promotions, suggesting an overall positive impact of promotional incentives on earnings.
These insights highlight the effectiveness of promotional strategies in boosting driver participation and payouts.
      /* Average single value for promo and regular periods and percentage change between payouts */

      select round(avg(avg_promo_payout),2) as avg_promo_payout, round(avg(avg_reg_payout),2)
      as avg_regular_payout,
      round(100.0 * (avg(avg_promo_payout) - avg(avg_reg_payout)) / avg(avg_reg_payout),2) || '%'
      as change_percentage
      from (
      /* Average payout values for each period and percentage change per driver */

      select distinct p.DriverID,
      round(avg(iif(o.order_date Between pr.Promotion_Begin and pr.Promotion_End and os.OrderStatus = 'Completed', p.price_payout, null)),2)
      as avg_promo_payout,
      round(avg(iif(o.order_date < pr.Promotion_Begin or o.order_date > pr.Promotion_End and os.OrderStatus = 'Completed', p.price_payout, null)),2)
      as avg_reg_payout,
      round(100.0 * (avg(iif(o.order_date Between pr.Promotion_Begin and pr.Promotion_End and os.OrderStatus = 'Completed', p.price_payout, null))
      - avg(iif(o.order_date < pr.Promotion_Begin or o.order_date > pr.Promotion_End and os.OrderStatus = 'Completed', p.price_payout, null)))
      /avg(iif(o.order_date < pr.Promotion_Begin or o.order_date > pr.Promotion_End and os.OrderStatus = 'Completed', p.price_payout, null)),2) || '%'
      as change_percentage
      from payout p
      inner join promotions pr on pr.DriverID = p.DriverID
      inner join orders o on o.OrderID = p.OrderID
      inner join Order_Status os on os.OrderID = p.OrderID
      group by p.DriverID
      having avg_promo_payout is not null and avg_reg_payout is not null
      order by avg_promo_payout desc)
3. Driver Engagement and Retention
In 2024, 461 new drivers joined Courierly. Impressively, all of them remained active, having completed at least one order in the last four months of the year. This indicates strong engagement and retention, which is crucial for sustaining an efficient delivery network.
      with drivers_joined_2024 as (
        select driverid, name,
        count(driverid) over (partition by strftime('%Y', date_of_joining)) as joined_2024
        from Drivers
      where strftime('%Y', date_of_joining) = '2024')

      select count(distinct d.driverid) from drivers_joined_2024 d
      left join Order_Status os on os.driverid = d.driverid
      left Join Orders o on o.OrderID = os.OrderID
      where o.order_date >= datetime('2024-12-31','start of month', '+30 days', '-4 month')
      and os.OrderStatus = 'Completed'
4. Impact of Company Stickers on Order Completion
Drivers who displayed Courierly stickers on their cars completed 3,633 more orders than those without stickers:
- Drivers with stickers: 26,129 orders
- Drivers without stickers: 22,496 orders
This suggests that branding and visibility might influence order acceptance and completion rates.
      with stickers as (select count(iif(d.[Sticker_(Y/N)] = 'Y', os.OrderID, null))
      as orders_with_stickers,
      count(iif(d.[Sticker_(Y/N)] = 'N', os.OrderID, null)) as orders_without_stickers
      from Order_Status os
      left join Drivers d on d.DriverID = os.DriverID
      where os.OrderStatus = 'Completed')

      select orders_with_stickers, orders_without_stickers,
      (orders_with_stickers - orders_without_stickers)
      as difference from stickers
5. Vendor Contribution to Revenue
A comparison between corporate and personal vendors showed a clear disparity in revenue generation:
- Corporate vendors: $9,908,430.55 (77.77% of total revenue)
- Personal vendors: $2,831,441.03 (22.23% of total revenue)
Corporate vendors are the primary revenue drivers, emphasizing the importance of maintaining strong partnerships with businesses.
      with sorted_vendors as (select sum(iif(v.Vendor_Type = 'Personal', Price, null))
      as personal_total_revenue,
      sum(iif(v.Vendor_Type = 'Corporate', Price, null))
      as corporate_total_revenue from Vendors v
      left join Orders o on o.VendorID = v.VendorID)

      select personal_total_revenue,
      round(personal_total_revenue/(personal_total_revenue + corporate_total_revenue) * 100,2) || '%'
      as personal_percentage, corporate_total_revenue,
      round(corporate_total_revenue/(personal_total_revenue + corporate_total_revenue) * 100,2) || '%'
      as corporate_percentage from sorted_vendors
6. Order Distance by Vendor Type
The average distance per order showed negligible differences between vendor types:
- Personal vendors: 126.41 miles
- Corporate vendors: 126.50 miles
This suggests that order distances are relatively consistent regardless of vendor type, indicating a stable distribution pattern in delivery logistics.
      with avg_distance as (select avg(iif(v.Vendor_Type = 'Personal',o.total_distance, null)) as personal_average_distance,
      avg(iif(v.Vendor_Type = 'Corporate',o.total_distance, null)) as corporate_average_distance
      from Orders o
      left join Vendors v on v.VendorID = o.VendorID)

      select round(personal_average_distance, 2) as personal,
      round(corporate_average_distance,2) as corporate from avg_distance
7. Order Cancellations and Rejections
A significant portion of orders—44.02%—were either canceled or rejected. Further breakdown reveals:
- Corporate vendor cancellations: 78.08%
- Personal vendor cancellations: 21.92%
Analyzing distance-based patterns:
- Orders canceled with a short-to-average distance: 49.45%
- Orders canceled with an average-to-long distance: 50.55%
This suggests that corporate vendors are responsible for a disproportionate share of cancellations, while distance has little impact on order rejections.
      /* Number of canceled orders */
      with cancelled_orders as (select o.OrderID, o.Total_Distance, o.VendorID from Orders o
      left join Order_Status os on os.OrderID = o.OrderID
      where os.OrderStatus in ('Cancelled', 'Rejected')),
      /* The total percentage of cancelled/rejected orders*/
      percentage_of_cancellations as (
        select round(100.0 * (count(co.OrderID))/(select count(orderid) from Orders),2) || '%'
        from cancelled_orders co)

      /* Percentage of cancellations among canceled orders based on different criteria */
      select round(100.0 * count(iif(v.Vendor_Type = 'Corporate', o.orderid, null))/ count(o.OrderID), 2) || '%' as percent_corporate,
      round(100.0 * count(iif(v.Vendor_Type = 'Personal', o.orderid, null))/ count(o.OrderID), 2) || '%' as percent_personal,
      round(100.0 * count(iif(o.Total_Distance <= (select avg(total_distance) from Orders), o.orderid, null))/ count(o.OrderID), 2) || '%' as min_to_avg_distance,
      round(100.0 * count(iif(o.Total_Distance > (select avg(total_distance) from Orders), o.orderid, null))/ count(o.OrderID), 2) || '%' as avg_to_max_distance from cancelled_orders o
      left join Vendors v on v.VendorID = o.VendorID
Tableau Visualization
To better illustrate the findings of this analysis, a Tableau dashboard has been created to visualize key performance metrics, including driver activity, payout trends, vendor revenue contributions, and order patterns. This interactive tool provides stakeholders with an intuitive way to explore the data and derive actionable insights for strategic decision-making.
Conclusion
Courierly’s data-driven insights provide valuable lessons for optimizing performance and business strategy:
- Top-performing drivers can be incentivized further to sustain high completion rates.
- Promotions effectively increase earnings but should be structured to minimize outliers with lower payouts.
- Driver engagement remains strong, ensuring a stable workforce.
- Company branding (stickers) appears to influence order completion positively.
- Corporate vendors dominate revenue generation, making them key business partners.
- Cancellation rates are highest among corporate vendors, highlighting an area for process improvement.
By leveraging these insights, Courierly can refine its operational strategies, improve vendor relations, and enhance driver engagement to ensure continued growth in the competitive delivery landscape.